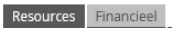
A view component can consist of multiple tabs, which show additional information of the selected process component. By clicking on a tab, the corresponding information is displayed. In the image above there is a choice between 'Resources' and 'Financieel', where the 'Resources' tab is currently selected. These tabs are part of the example image 'Strategische Behoefte'.
It is possible that tables are larger than the screen size. There are several possibilities to navigate through these tables in Anago. If the table is too large for the screen, there will be scroll bars below and/or to the right of the table.
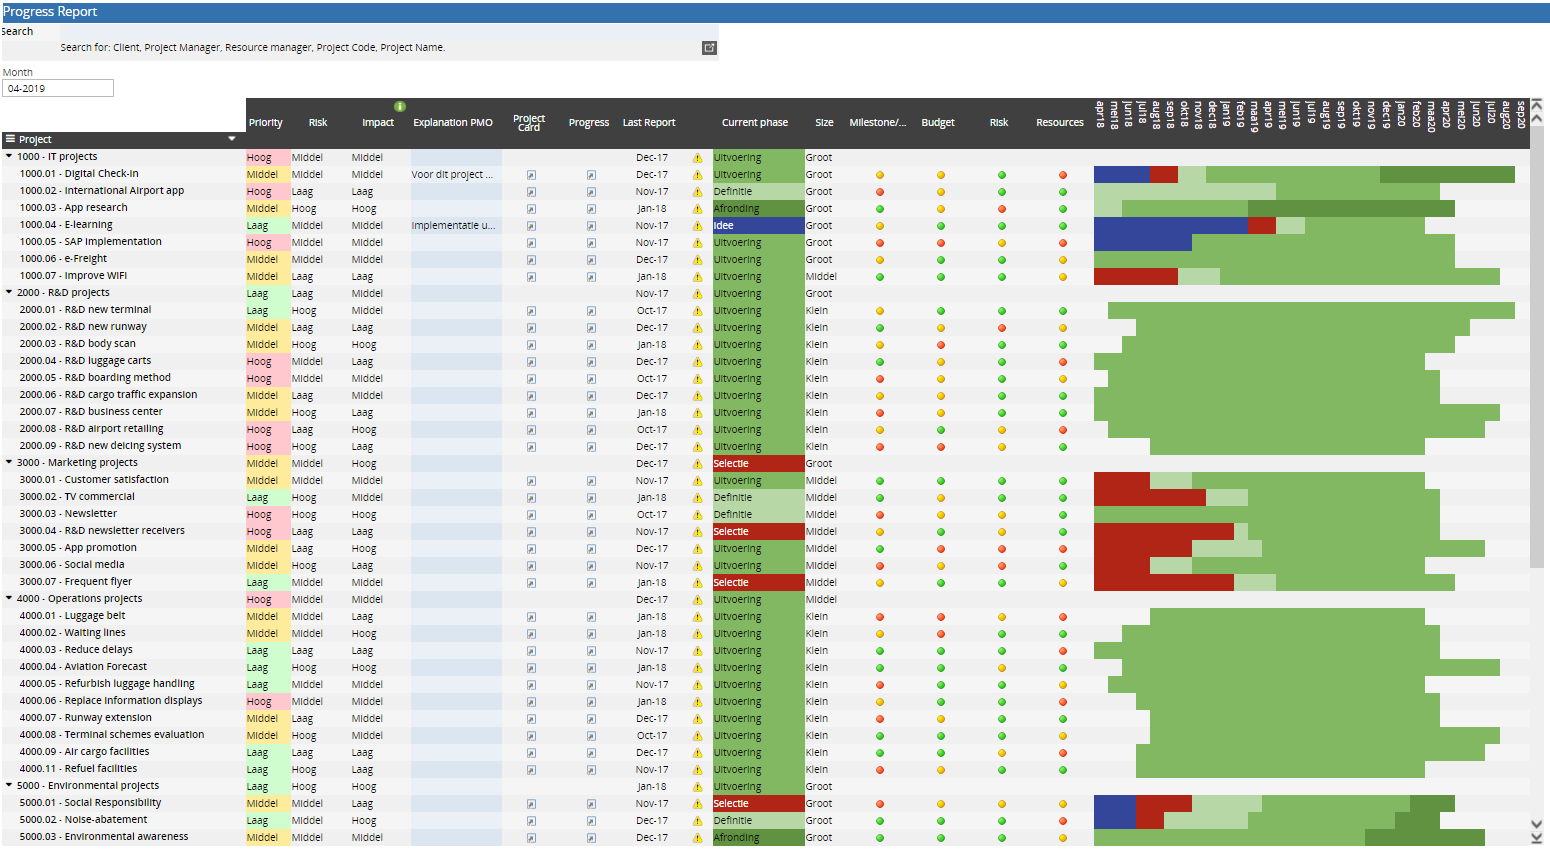
The arrow buttons at the end of the scroll bar and the scroll bar itself can be used by clicking on it with the mouse. The table below explains the different functions:
|
|
Shifts the screen to the left and to the right |
|---|---|
|
|
Shifts the screen up and down |
|
|
By clicking on the scroll bar, holding it with the mouse and moving the mouse in the direction of the scroll bar, the screen shifts in the desired direction |
|
|
By using these buttons, the screen sprints directly to the very end of the screen, in the direction of the chosen arrow |
An arbitrary cell within a table can also be selected, after which the keyboard can be used to navigate through the table. The table below explains the different keys:
| The arrow keys (left / right / up / down) | Moves the cell selection a cell left / right / up / down |
| Tab | Moves the cell selection to a cell to the right up to and including the end of the row |
| Page up/down | Moves the rows shown in the table up or down a page |
When the last cell in a row of a table is selected, in most cases the selection will jump to the first cell of the next row when the right arrow or tab key is used. When the last cell of the last row of the table is selected, nothing will happen.
Filter
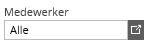
Another possibility to display information in Anago is by means of tables and/or graphs with a filter. In that case there is a filter above the relevant table/graph, in which the desired data selection can be selected.
Select this by using the filter button (), after which the table or graph will display the information concerning this specific group, department or time frame for example.
Tooltip
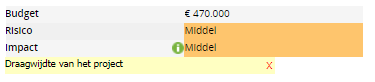
It is also possible that fields contain extra information. There are two cases of extra information. One way extra information can be visible is by hovering over a field.
The other possibility is in case of a green information icon. By clicking on that icon extra information about the corresponding cell will become visible.