A view shows the results of a model or statistical report in the form of tables and graphs. A view can consist of one or more tabs and / or view components. Of the various view components which are explained below, the drill-down view is an important and often recurring phenomenon.
The tables and graphs show the information in a view. Light-colored cells are 'read-only' and dark-colored cells are editable.
Some cells contain a 'choose value variable' () button. This button can indicate three situations. The button can indicate that the relevant field consists of a text box with multiple lines of text, that the cell value can be chosen from an existing list, or that the cell value can be chosen in a calendar view.
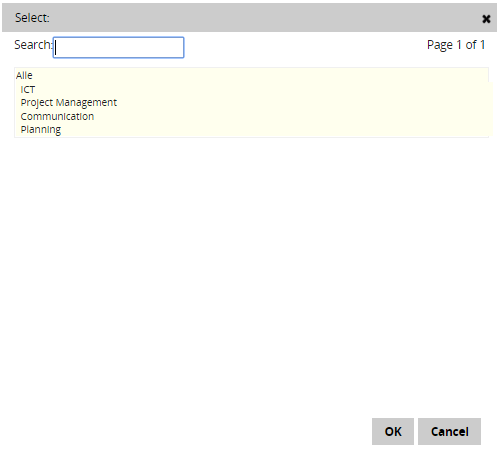
In the second case, this means that the information displayed depends on the selected cell value. When clicking on the 'choose value variable' button, values can be chosen by selecting the relevant value in the displayed selection list, or the preferred value can be searched using the search bar (see figure below).
The third situation contains a calendar. In some situations data is displayed as a list box as described above, but in most situations a calendar will appear. This looks like this:
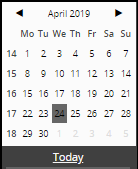
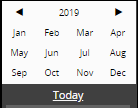
To select a time period, the months and years can be navigated by clicking on the arrows left and right of the current month / year. It is also possible to quickly navigate through the years and months by working at a higher level in the calendar. Click on the month / year bar for this; 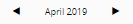 . Subsequently all months of the current year will be shown. When this bar is clicked again, an overview of 12 consecutive years is shown.When the year and month are selected, a week can be selected by clicking on the relevant week number, a day can be selected by clicking on the relevant date. It may be that there is already a pre-selection on the selectable data. The image below is an example where only the months of a year can be selected.
A search bar is located at the bottom of the calendar view. A specific date can be searched for in this search bar, or a time concept can be entered that will be searched for. Examples of timeframes that can be entered are: 'today', 'tomorrow', 'yesterday', '1week', '2weeks' and 'monday' (or any other day of the week).
Drill-down views appear in many tables. These drill-downs contain deeper information about the cell in question.
For more information about Data entry or drill-down views, click on the relevant topic.
Drill-down
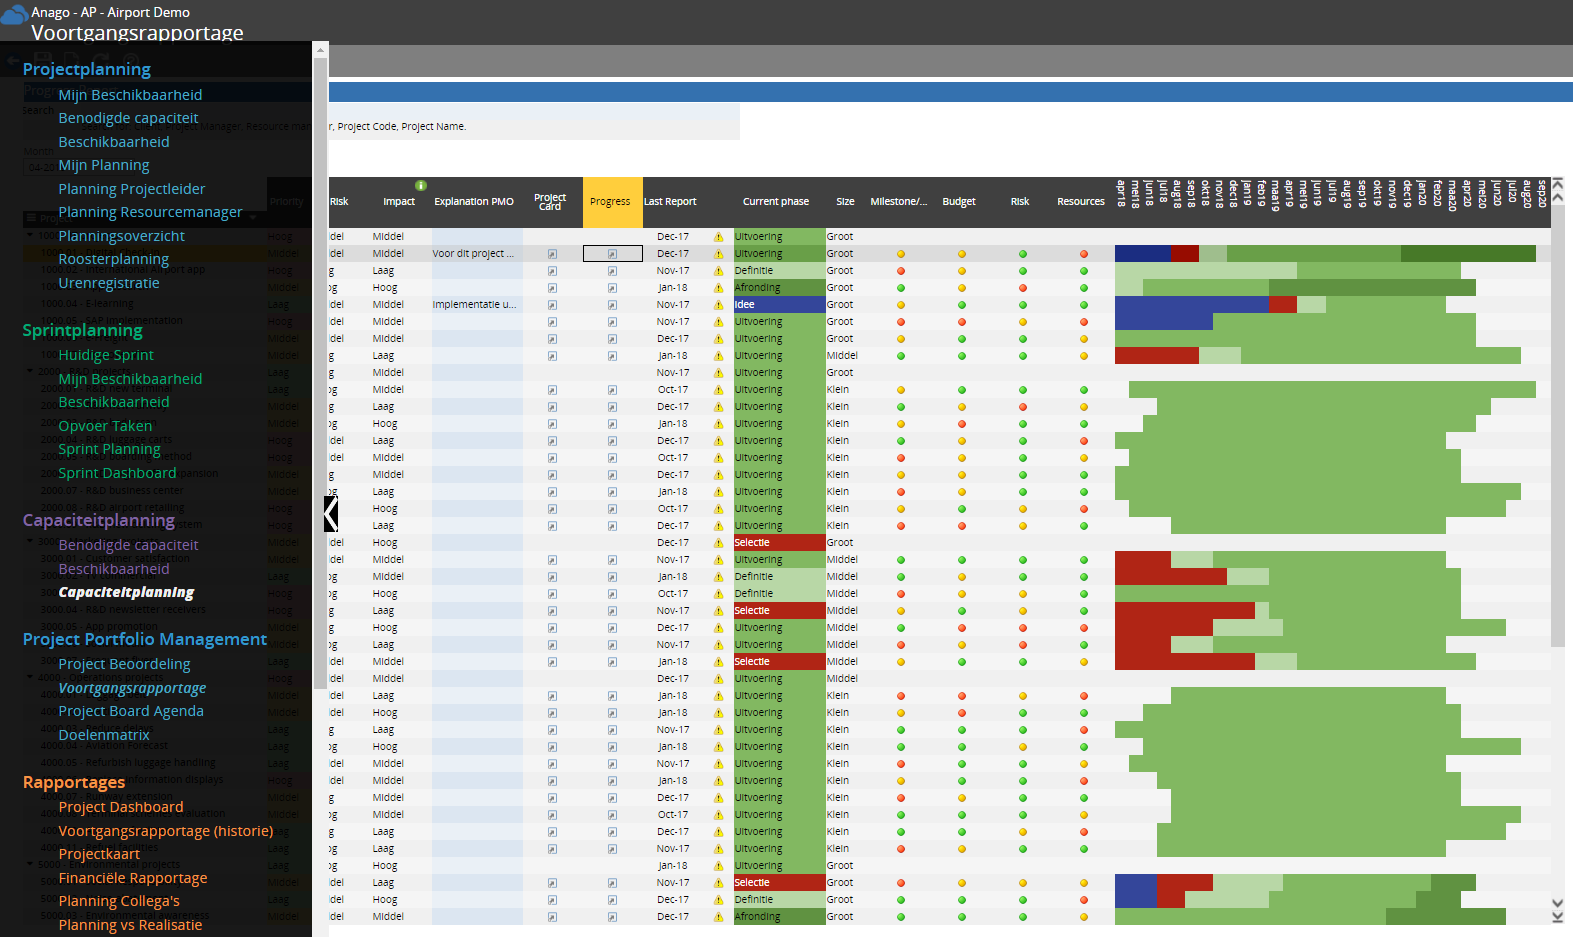
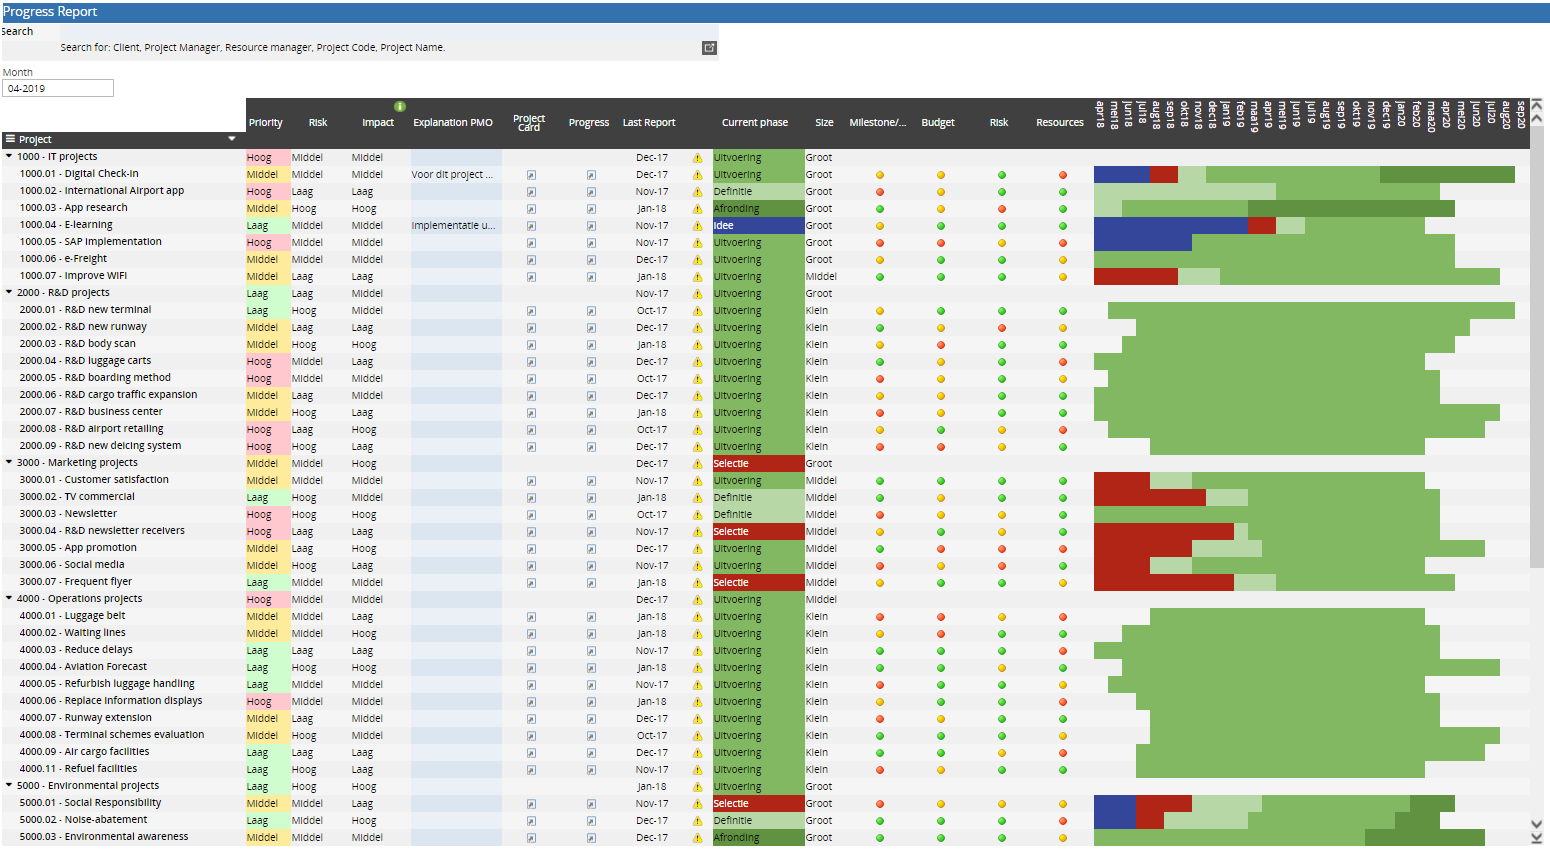
Some tables in the application contain a drill-down. A drill-down is a special view that is opened within another ('main') view. The cells that contain a drill-down can be recognized when the user moves the cursor over the cell in question. The cells with a drill-down will change from their original color to white. When one of these cells is clicked, the drill-down opens, revealing more information about this cell. This information can be viewed and / or changed.
For example, in the image below, there is a drill-down in the 'Progress' column. The cursor is kept here on the second cell in the column causing it to turn white.
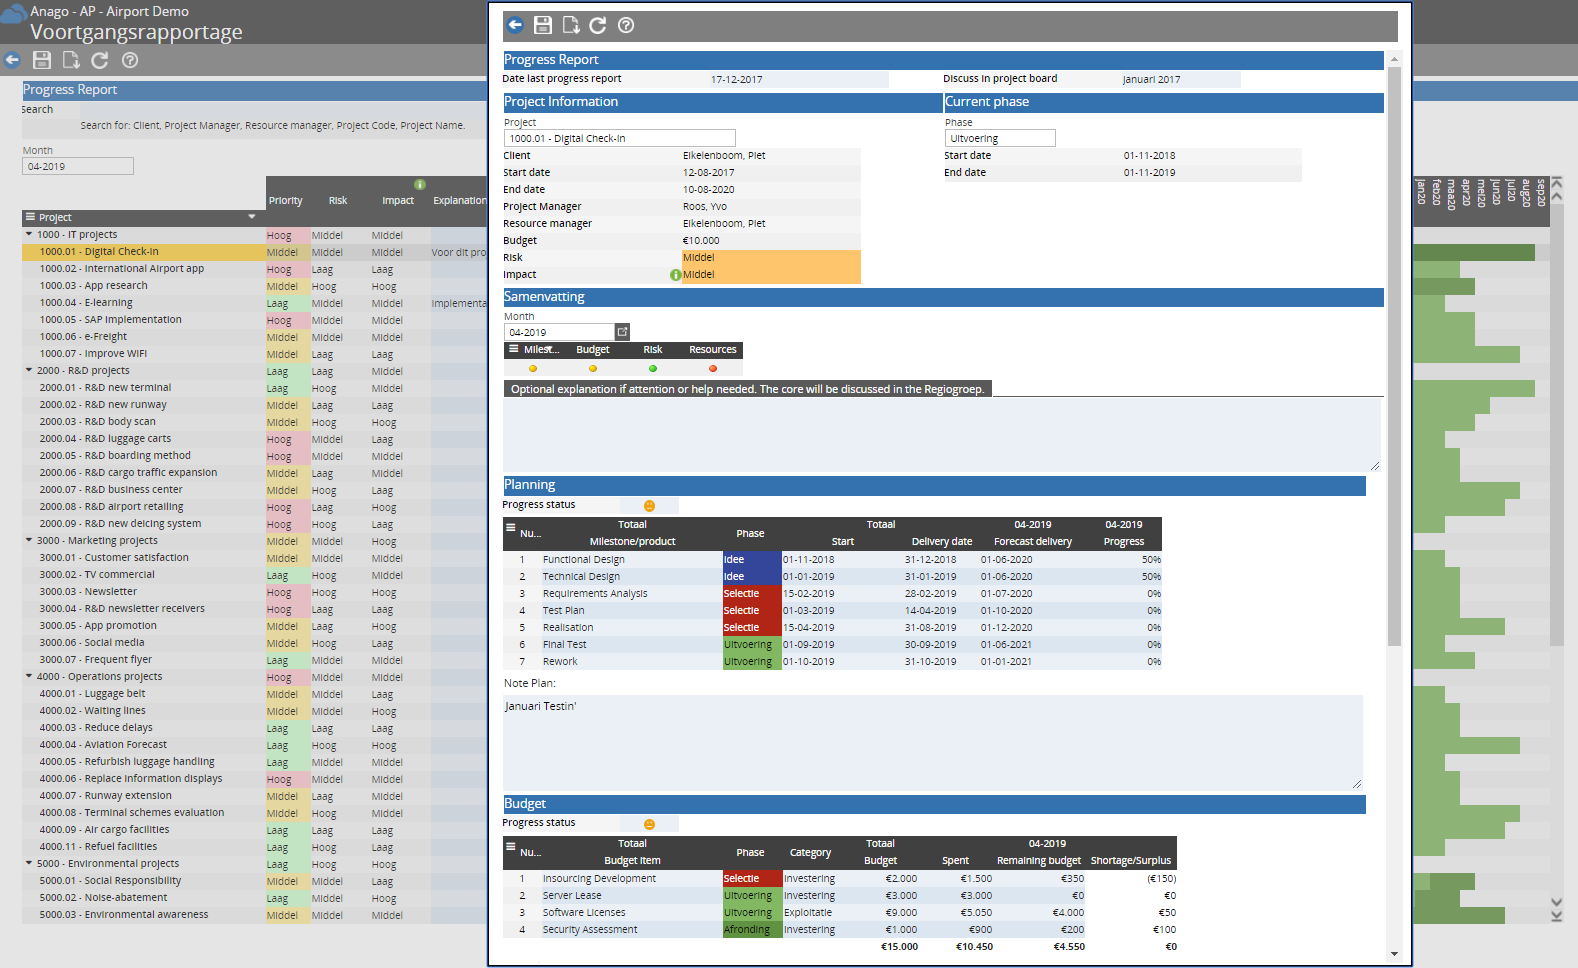
When the drill-down cell is clicked, the drill-down opens in a new window as shown in the image below. The functioning of the toolbars and buttons within a drill-down are the same as those of a view.
In this menu, there is an overview of all processes and process components of the application. When clicking on one of the process components, the relevant view for the selected time period (in the calendar) will open.When changes have been made to the current view, the application will first ask the user if these changes should be saved.